Uncovering Stories Through Journalism and Visualization
In Fall 2023, I took a data journalism course. In addition to developing a solid background in using data visualization software, such as Tableau and Datawarapper, we also learned the basic tools of journalism – retrieving and cleaning public data, interviewing people, and the principles of journalistic writing. By the end of the class, I could analyze data, identify stories within the data, and finally create a new story with complete data visualizations.
In this class, we focused on Connecticut-based datasets to produce stories on local issues. For example, we examined datasets looking at the median household incomes across different races within Connecticut; reported police incidents by neighborhood, across various years, in the city of Hartford; and the total number of reported marijuana infractions by age and gender across counties. These were all raw datasets from the official state website, which we learned how to retrieve and clean. We then learned how to analyze the datasets to find stories in the data. Subsequently, we visually conveyed the trends through pivot tables, bar graphs, scatter plots, heat maps, or choropleth maps.
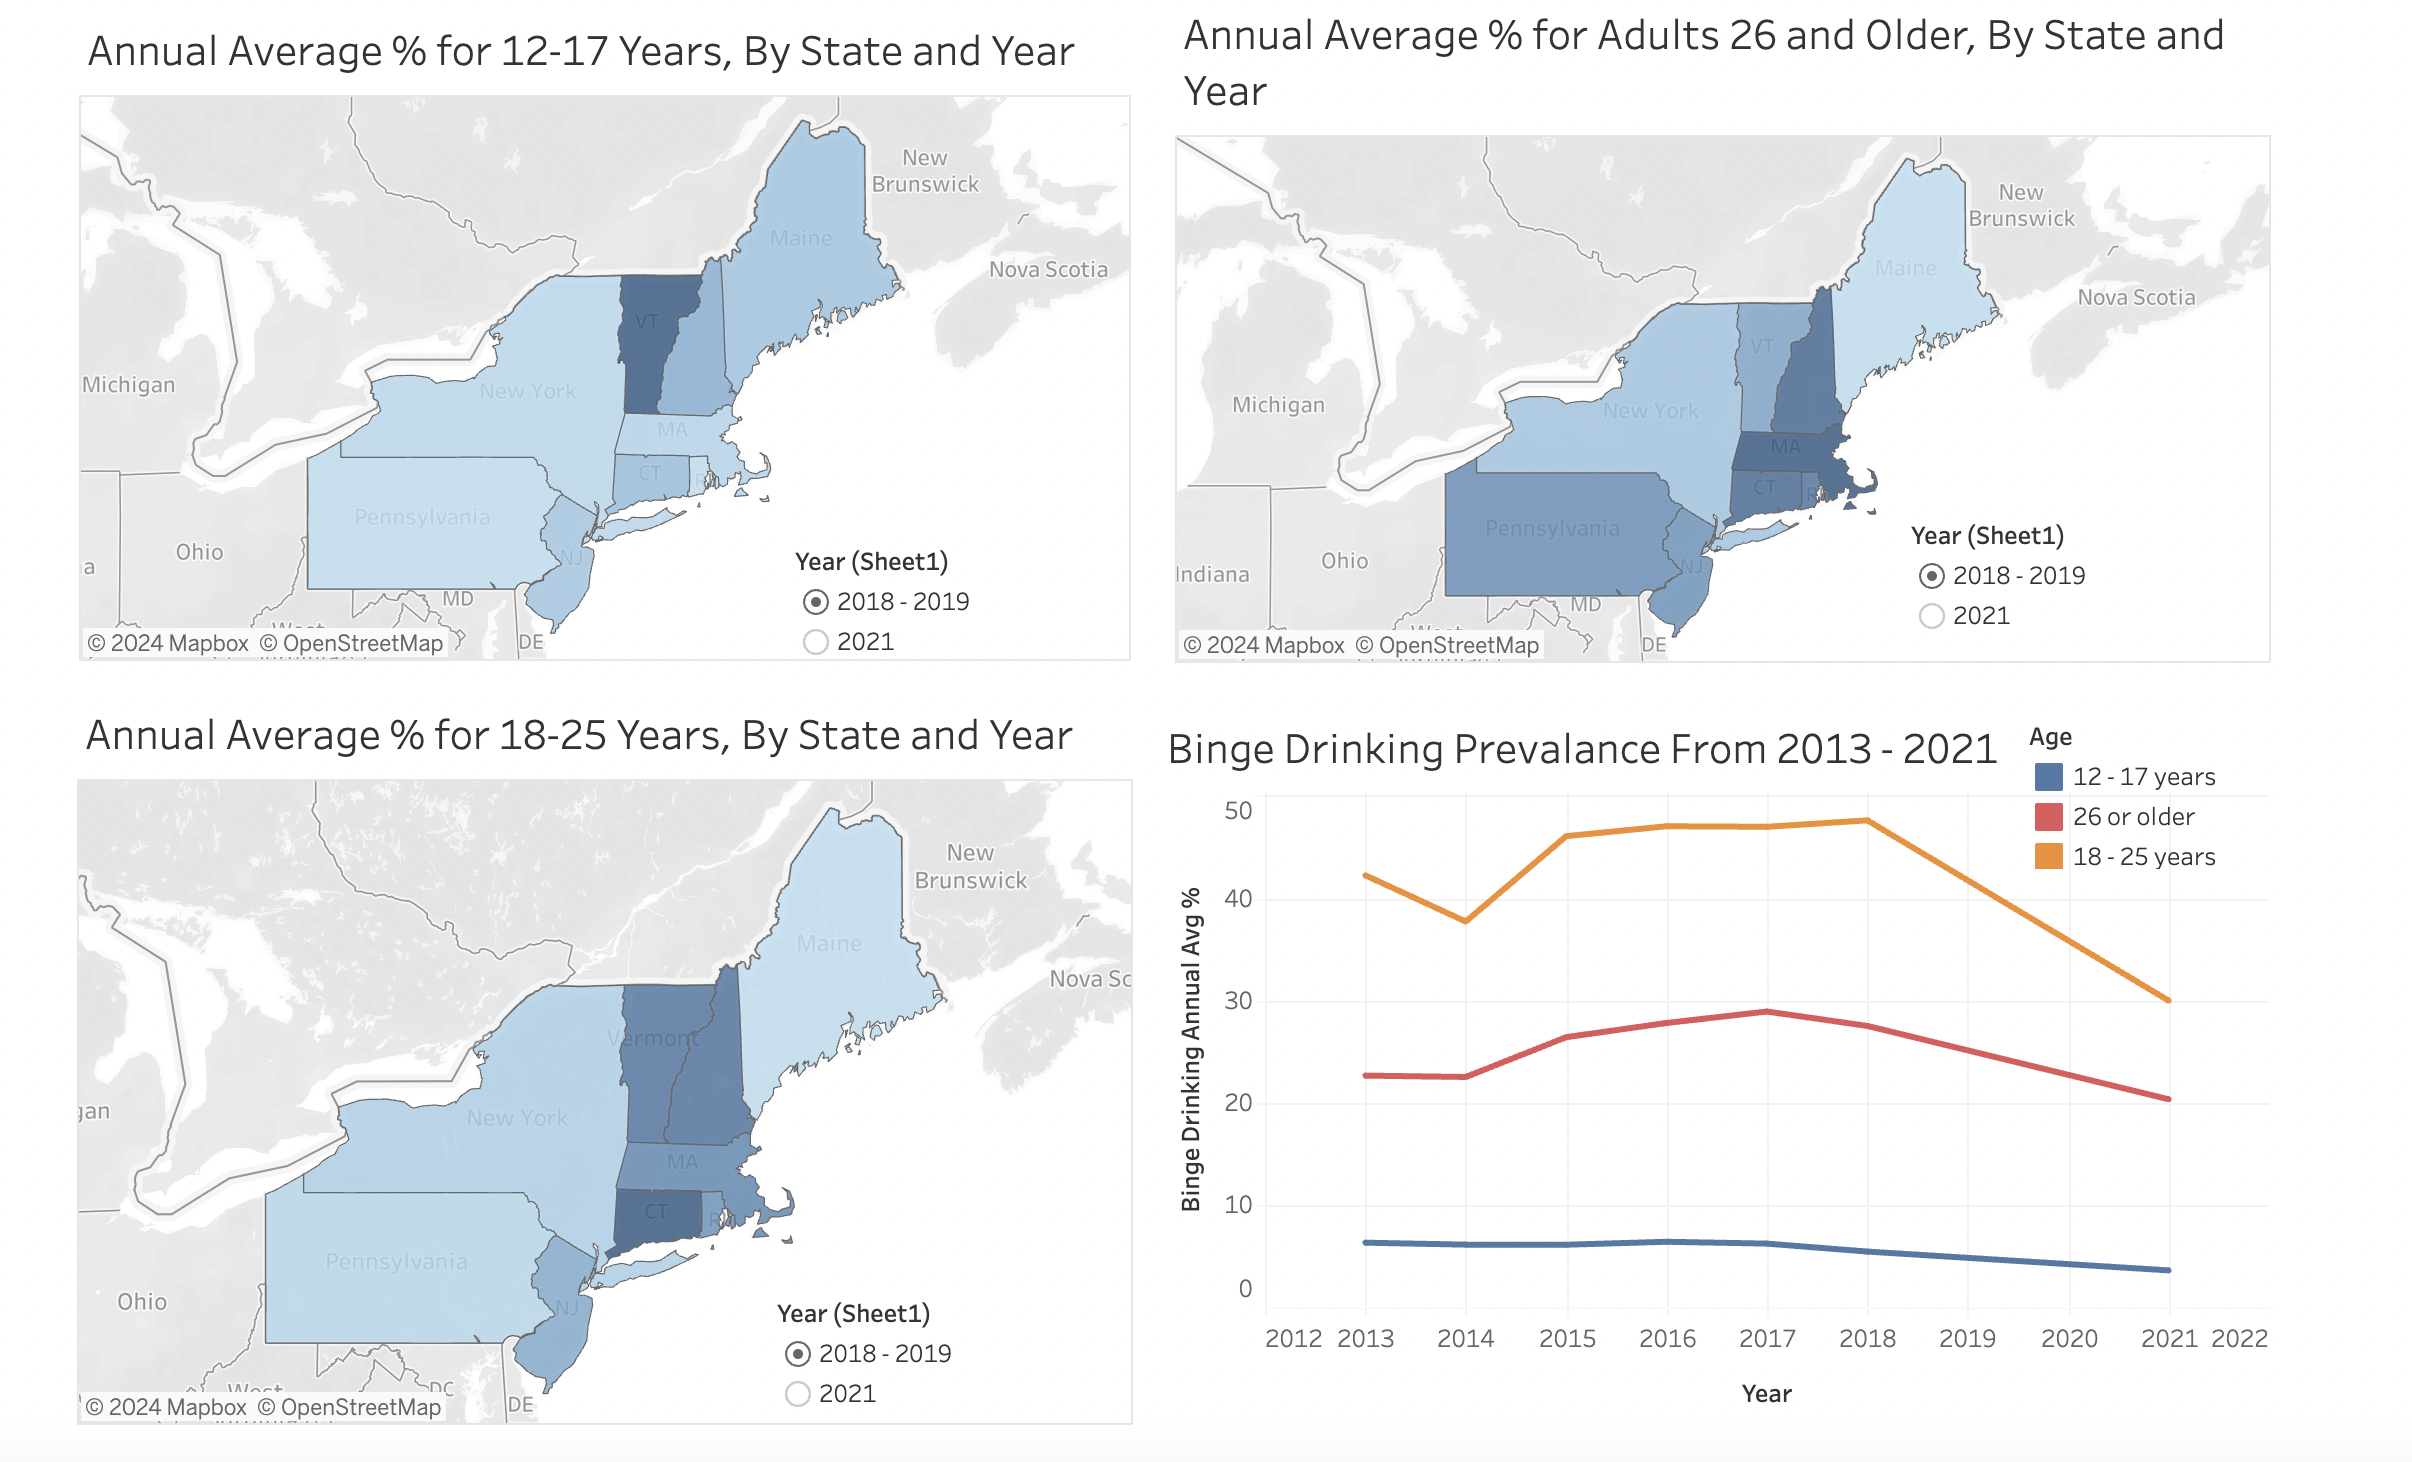
For my independent final project, I chose a dataset that looked at average binge drinking rates, per age group, across all the U.S. states. I focused on comparing Connecticut’s decline in binge drinking rates post-pandemic, to other Northeast states.
I also interviewed key people with knowledge about the drop in binge drinking rates in Connecticut. These were the Behavioral Health Program Manager in CT’s Department of Mental Health and Addiction Services, Clinical Supervisors at nearby Rehabilitation Centers, the Director of Health Education at my university, and students from other CT universities. Their insights provided a rich and multi-dimensional perspective to my story and data findings.
I then created three maps of the Northeast region, each highlighting a different age group, to visually narrate the story of changing binge drinking rates before and after the pandemic.
Through this class and my final project, I developed a solid foundation in the technical aspects of data journalism and gained an appreciation for the power of data in storytelling. The most interesting aspect was learning that behind every dataset lies a story – you just need to uncover it!